Ditch your Status Page: How we monitor Crisp at scale
The Crisp technical architecture runs around 40+ different micro-services, all replicated across different physical machines. Adding to that, we have around 20 daemons operating different tasks, eg. data storage with MongoDB, or email delivery with Postfix. Those microservices handle 1 billion+ requests each month (this is growing). We need to know when something crashes, quickly. After a thorough analysis of the status page / monitoring solutions available on the market, either as SaaS or Open

The Crisp technical architecture runs around 40+ different micro-services, all replicated across different physical machines. Adding to that, we have around 20 daemons operating different tasks, eg. data storage with MongoDB, or email delivery with Postfix. Those microservices handle 1 billion+ requests each month (this is growing). We need to know when something crashes, quickly.
After a thorough analysis of the status page / monitoring solutions available on the market, either as SaaS or Open-Source, we figured a cost-efficient monitoring system for microservices was missing. Either SaaS status pages costs were adding up to a huge bill to monitor such a large number of services, or existing open-source solutions were simply not adapted.
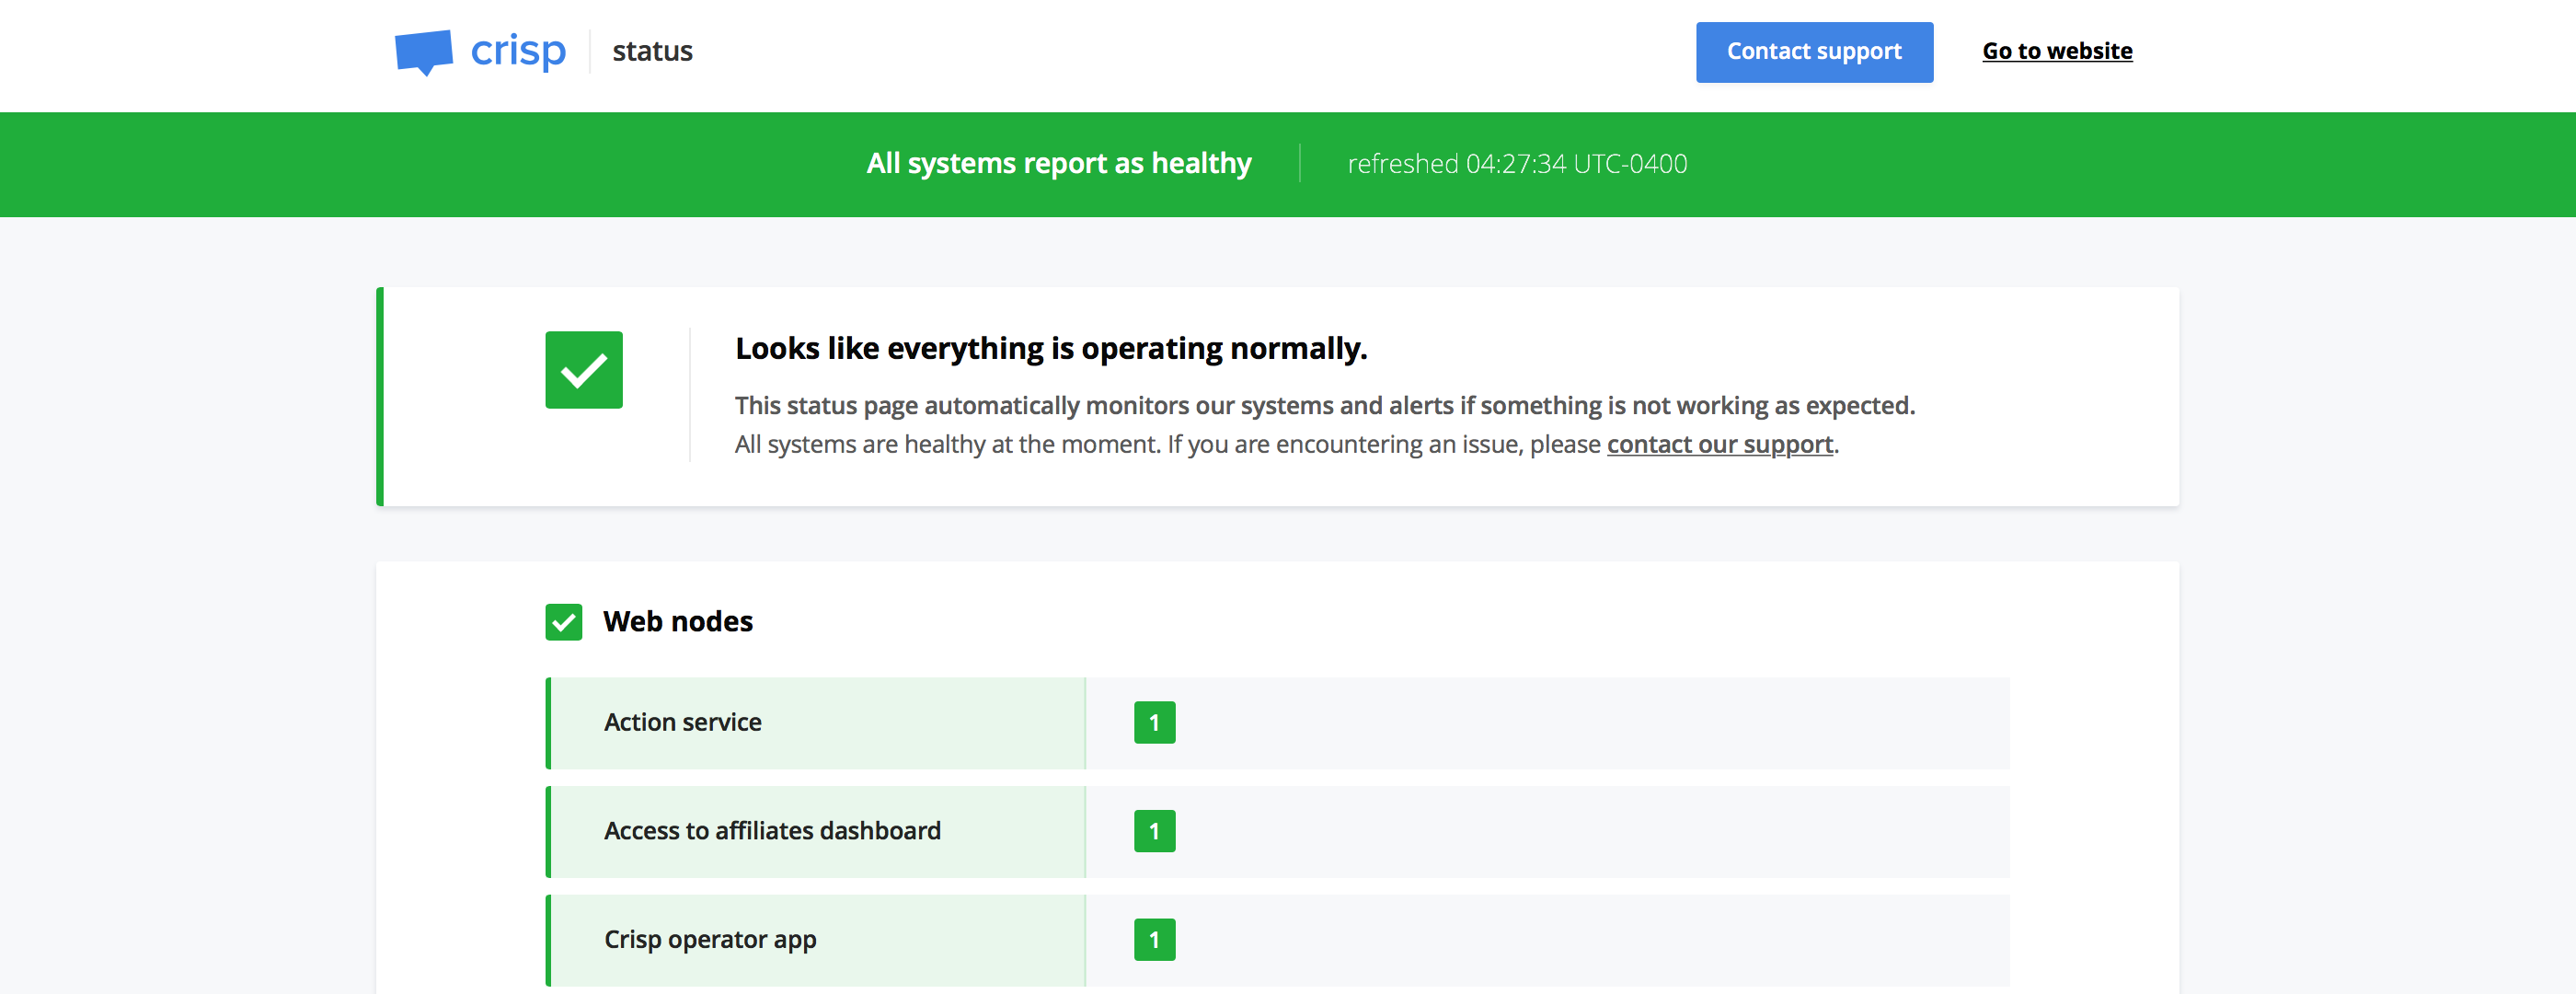
So, we built it ourselves: we called it Vigil (Vigil on GitHub). Check the Crisp Status Page to see it live.
After 2 years running Vigil internally as an internal project, we reworked its code and open-sourced it, as part of our wider open-source initiative at Crisp. We previously open-sourced some other infrastructure projects: Bloom, a REST API optimizer and Raider, an affiliates dashboard. We use all of them in production.

What Vigil does
Vigil is an open-source, self-hosted status page, monitoring and alerting system. It is built in Rust, which makes it reliable, lightweight and crash-free (at least, in theory).

Vigil lets you monitor any kind of node on your infrastructure, whether it be internal (on your LAN) or remote (over the Internet). Multiple monitoring techniques are implemented, thus letting you cover all your monitoring needs depending on the nature of the system / backend to monitor:
- Poll Probes: those probes periodically send requests to configured services to check for the response status. Those are either TCP or HTTP probes, and can be used to check the health of a service from an external point of view. For instance, you may use Poll Probes to check that a MySQL server is up and running on its TCP socket, or use the same kind of probe to monitor an API endpoint HTTP responses. Poll Probes are also able to show if a service is up, but slower than usual by analysing the request response time.
- Push Probes: those probes listen for monitoring advertisements from your apps. Push requests are performed from your own code, and sent to Vigil for analysis. Push Probes require the installation of a Vigil Reporter library in your microservice code (eg. NodeJS, Golang, Rust, etc.). Push Probes are used to monitor your own apps for uptime and performance (eg. they are able to send extra data on the server system load for instance).
Vigil has 3 status states (per-monitored app, and general):
- Healthy (green): all is up and running, performance is good
- Sick (orange): a service / some services might be slower than usual (eg. a system is under load)
- Dead (red): a service / some services are / might be down (probes did not report in due time)
The current infrastructure status can be checked in the blink of an eye, as the status page general status is the worst announced status of a running microservice. For instance, if all microservices show as healthy (green), but a single one shows as sick (orange), the general status will be sick (orange). Vigil also auto-refreshes the current status view, so that you can let it run in a background tab, or even show it on a TV in your offices (we don't do that, though).
How Vigil integrates to our apps
If you're looking to monitor NodeJS, Golang or Rust microservices, Vigil has native libraries called Vigil Reporter libraries. Those are running in your app, and actively reporting to Vigil status probes.
In our case, we use the NodeJS Vigil Reporter library, as most Crisp microservices are built in NodeJS.
Here's a simple example of how Vigil integrates to NodeJS apps:
var VigilReporter = require("vigil-reporter").VigilReporter;

var vigilReporter = new VigilReporter({
  url        : "https://status.crisp.chat",
  token      : "SECRET_TOKEN",
  probe_id   : "relay",
  node_id    : "socket-client",
  replica_id : "192.168.1.10",
  interval   : 30
});
This example shows how we initialize Vigil Reporter to monitor a node named socket-client (ie. the WebSocket microservice the Crisp chatbox connects to). socket-client is categorized in the relay probe group. The currently monitored node instance has LAN IP address 192.168.1.10, so we set it as the replica identifier. Multiple socket-client nodes are running in our infrastucture, so we'd have different replica identifiers reporting at once for the same node (this is why you see status boxes indexed as 1, 2, 3 for some lines on Crisp Status Page).
How Vigil alerts us
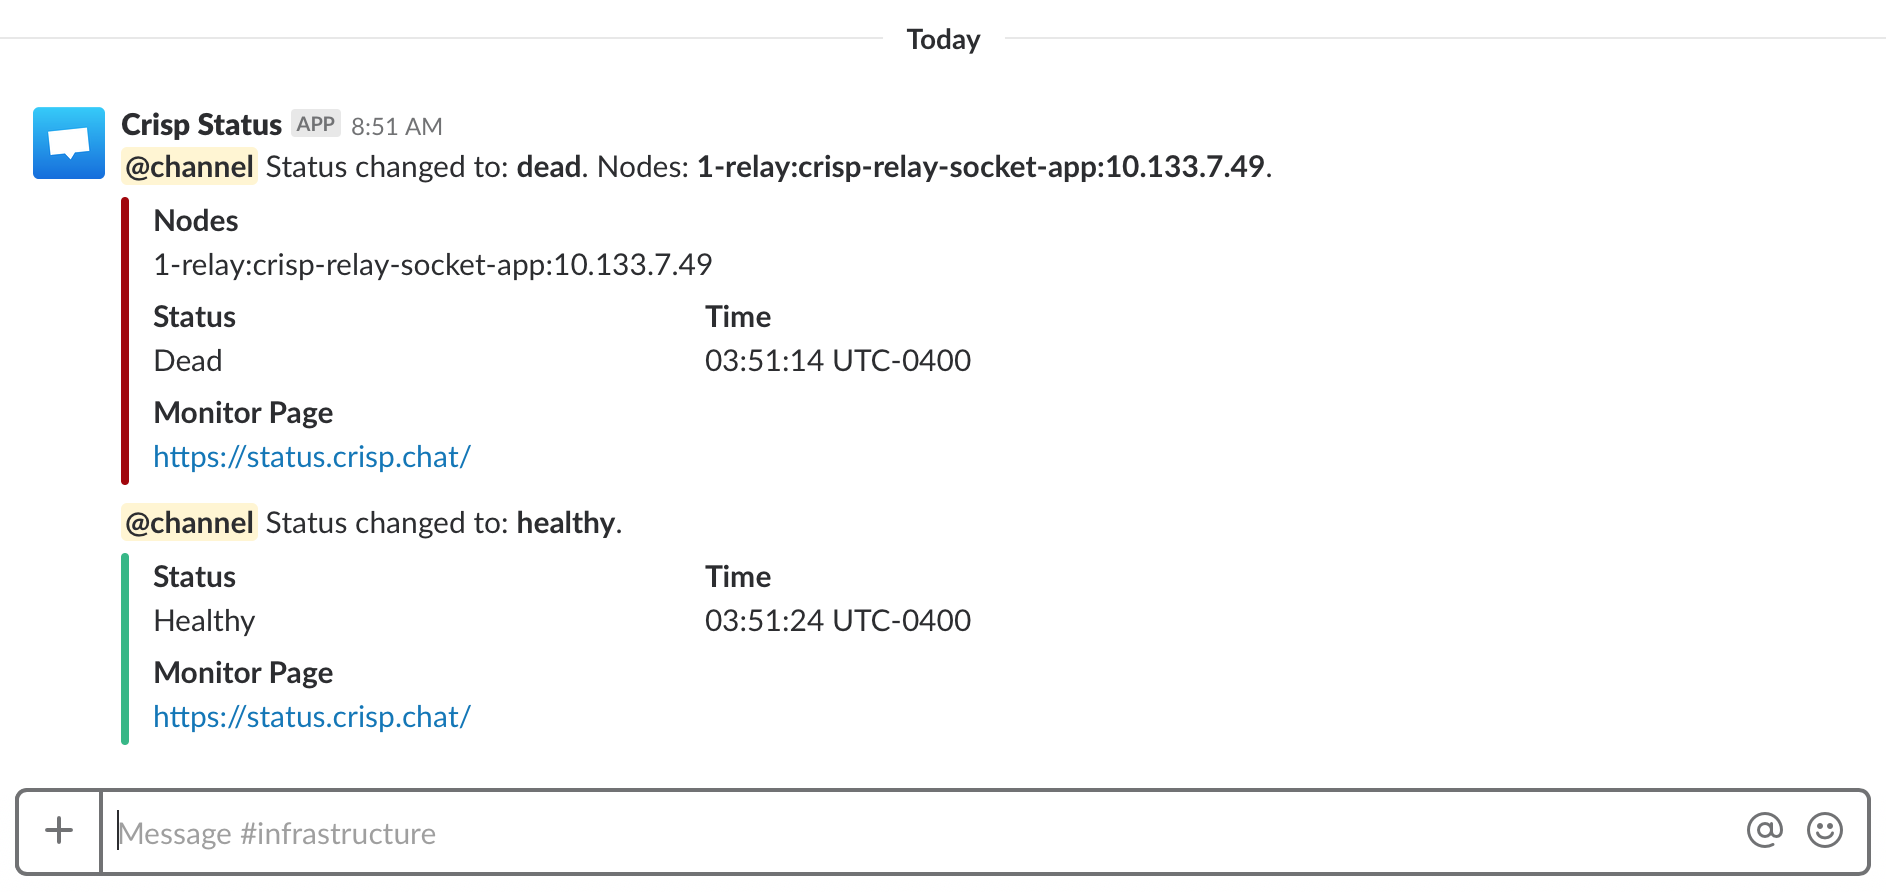
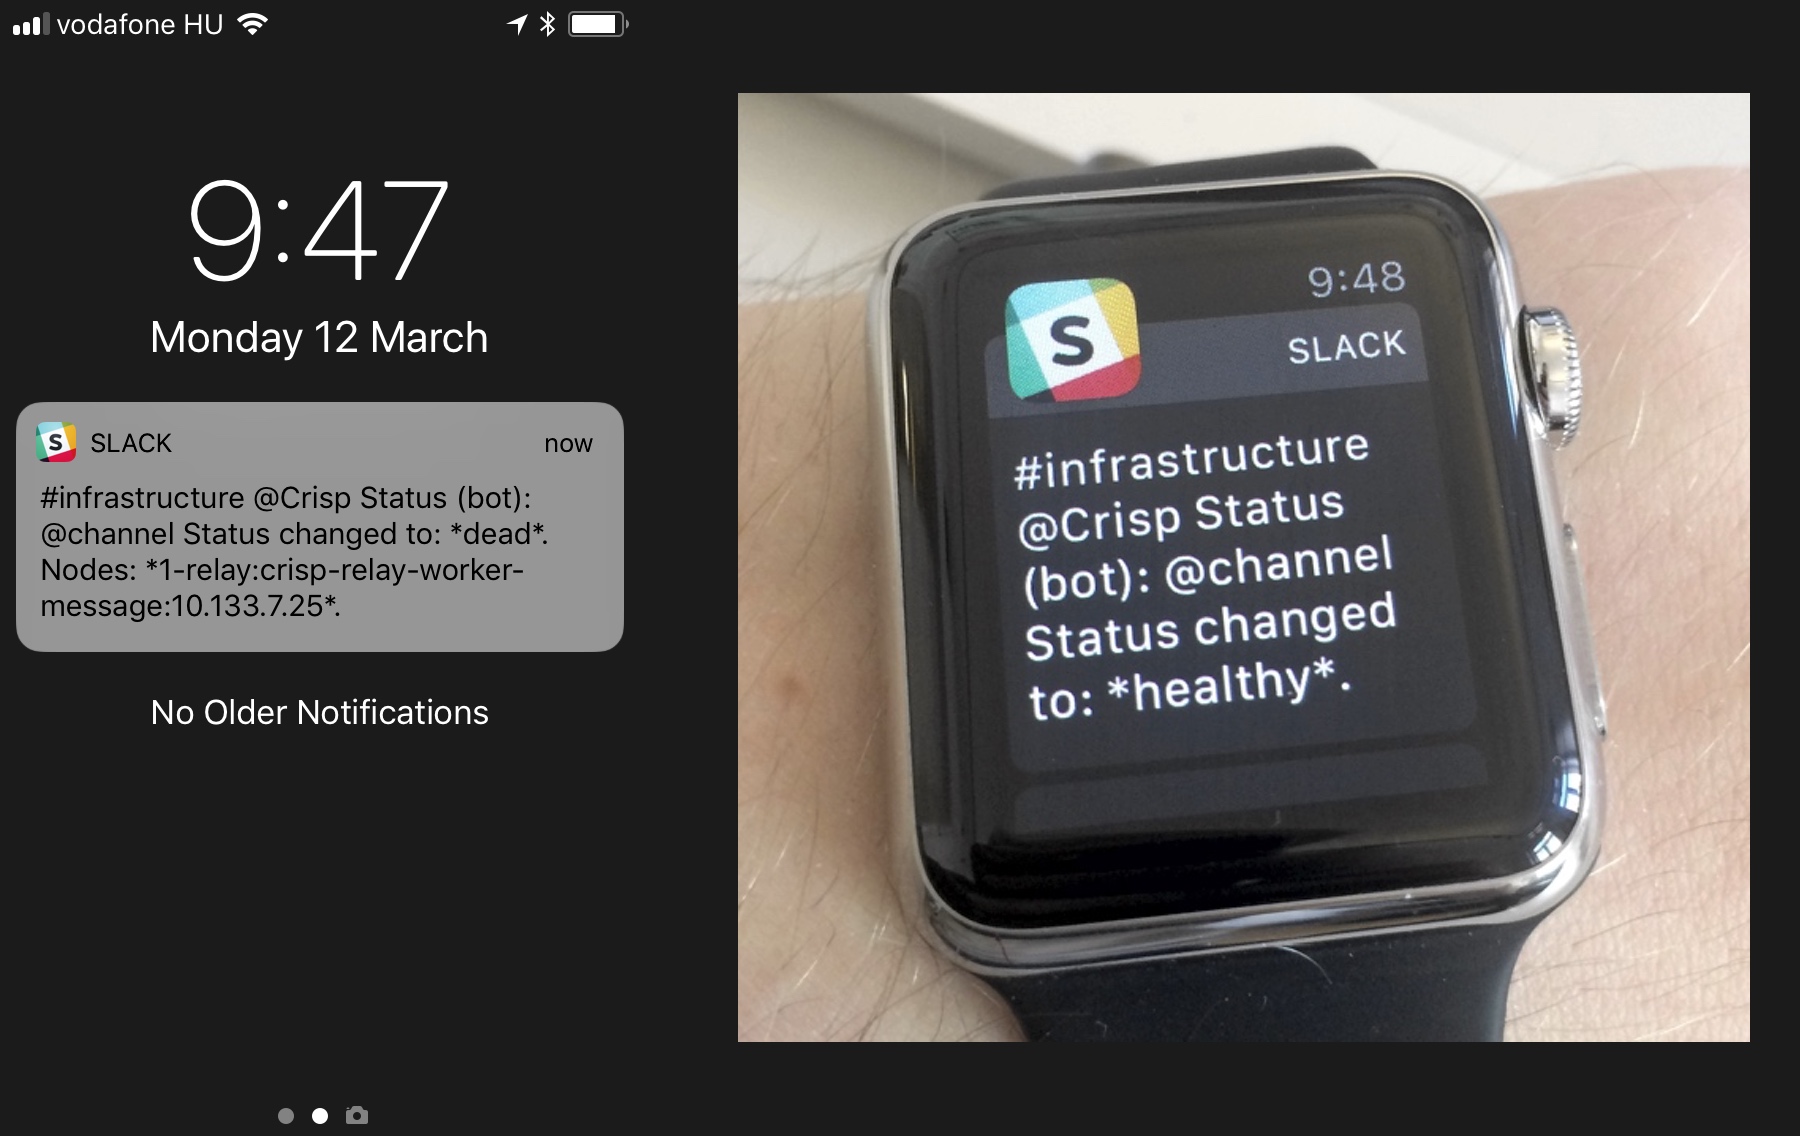
If a monitored services goes down (ie. becomes "dead"), Vigil will alert you / your team either via Slack or Email, or both; depending on your notification preferences. Slack alerts are especially useful, as they are routed in a #channel of your choice in your Slack team. Relevant team members can choose to opt-in for status notifications (eg. your sysadmins), and manage the way they want to be notified from Slack channel notification preferences (eg. on their mobile phone or Apple Watch, even if they are marked as away and not mentioned).
Slack notifications saved our life multiple times in the last 2 years. For instance, as Crisp CTO I am responsible for uptime. We are a distributed team, but that does not mean we have always somebody awake at anytime to manage non-planned downtime (eg. DDoS attacks, service overload caused by bugs, etc.).

Thus, as Crisp CTO, if a service goes down when I'm asleep, I need to make sure something wakes me up as quick as possible so that I can fix it in the minutes following downtime. This is where Vigil and my Apple Watch come into play; Vigil is able to send an unmuted Slack notification to the Watch I sleep with (I just made sure notifications to the Slack channel Vigil uses are delivered no matter what). I had such alerts twice in 2 years, which helped recover a failed server disk in due time at 1am (that down server was slowing down the whole platform), and mitigate a DDoS on our API and emailing system at 5am.

Vigil as your Status Page
Interested? You can easily setup Vigil on your own infrastructure, to monitor your SaaS, your blog, your personal server / services, etc. Go to Vigil GitHub page and follow installation instructions. A pre-built Docker image is available for convenience.
Feel free to open an issue if you need help, have a feature request or found a bug.


