Analytics 2.0 is here !
Discover our brand new analytics feature on Crisp. Numerous users asked us to have access to a deep analytics feature regarding Crisp software and we are proud to say that it's live !

Numerous users asked us to have access to a deep analytics feature regarding Crisp software and we are proud to say that it's live ! We've adapted Analytics so that you can easily find where you should improve and how things are going regarding your users : no vanity metrics, only actionable data. Let's have a look at the new features we have built and the amazing job the team has done.
Messaging
Messaging is a core feature for Crisp so we felt it was something we have to work on in order to bring value to our users.
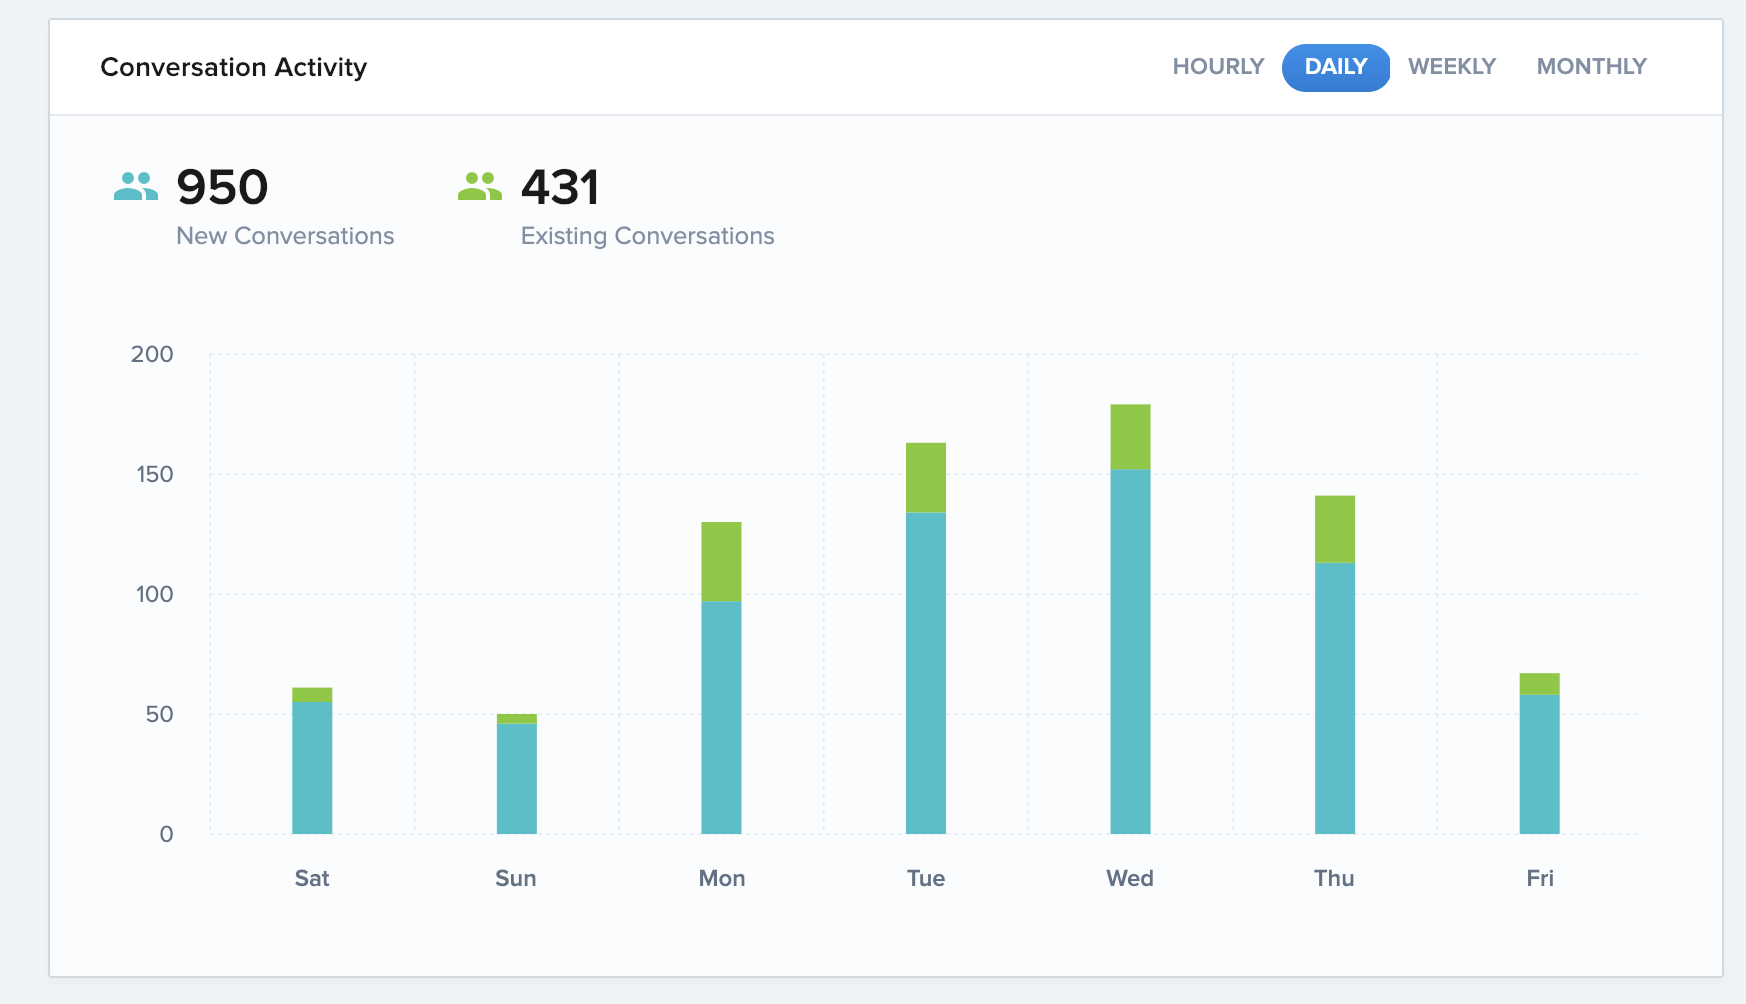
For the messaging analytics, you are now able to monitor :
- Global conversations activity of the week compared to the previous week regarding :
- Conversations number
- Average mean response time
- Website Visitors
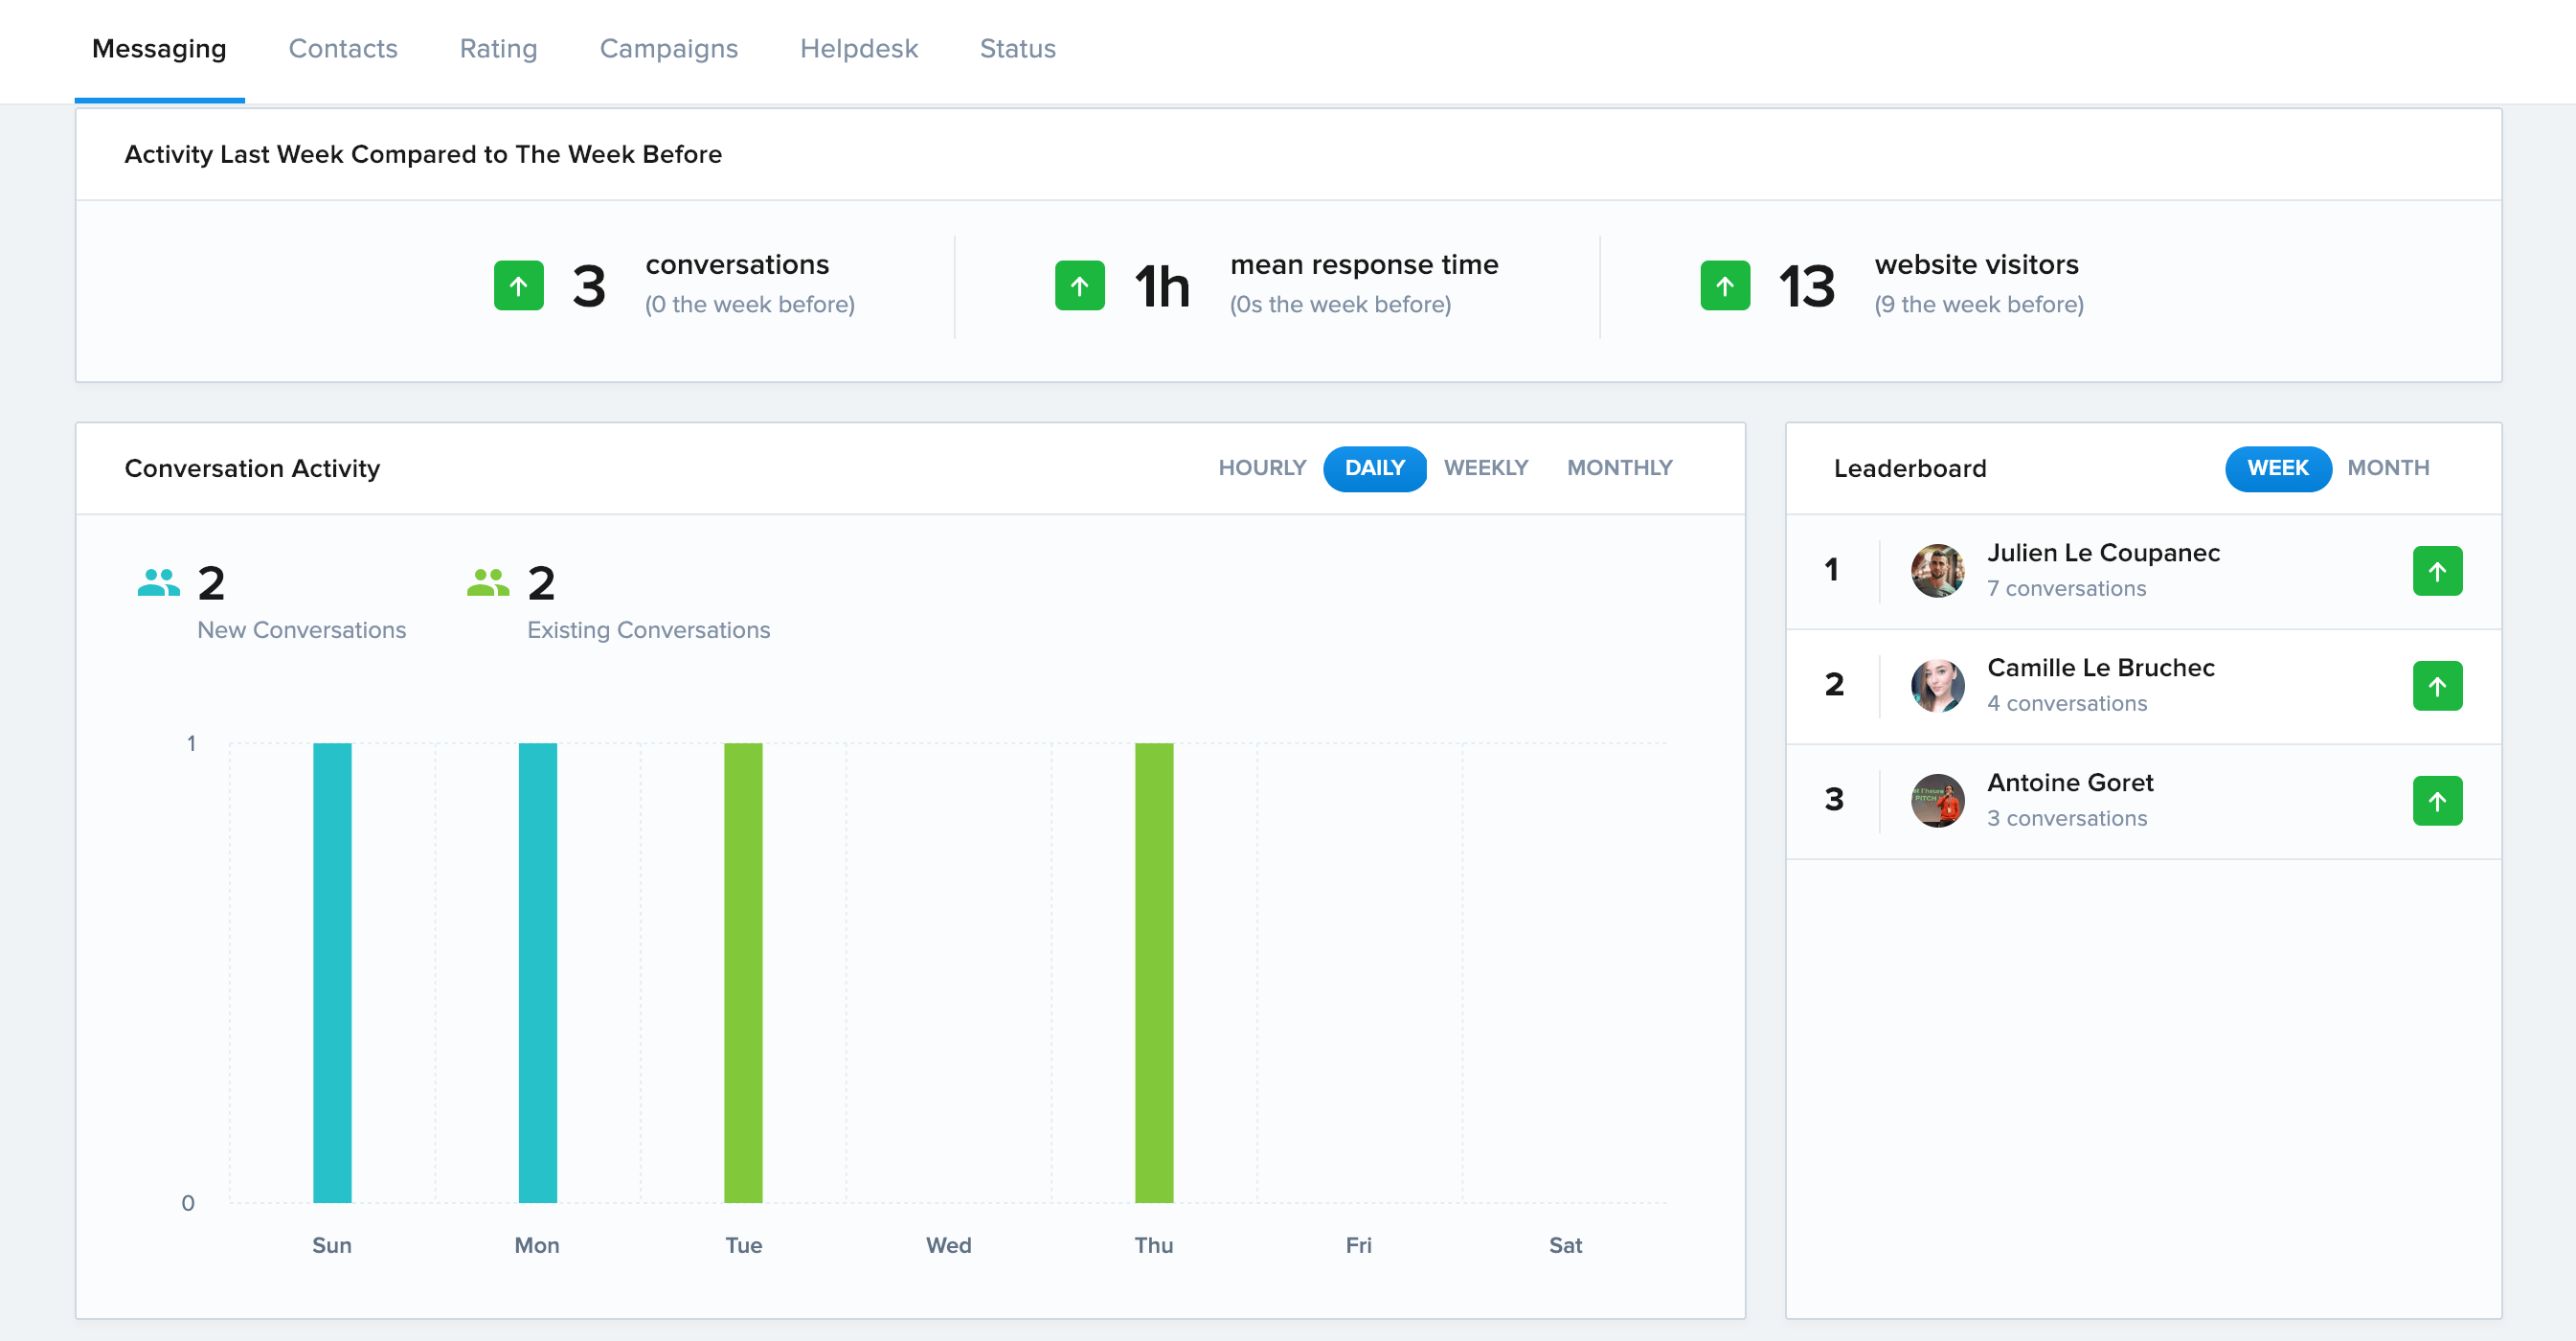
- Conversations activity by hours, days, weeks and months filtered by new and existing conversations
- Operators leaderboard by week and months based on conversations number.
- Supports responsiveness by hours of the week
- Assigned segment to users by hours, days, weeks and months filtered by kind of segments
- Most used shortcuts by hours, days, weeks and months
- Assigned conversations by hours, days, weeks and months filtered by operators
- Fired triggers by hours, days, weeks and months filtered by triggers
Contacts
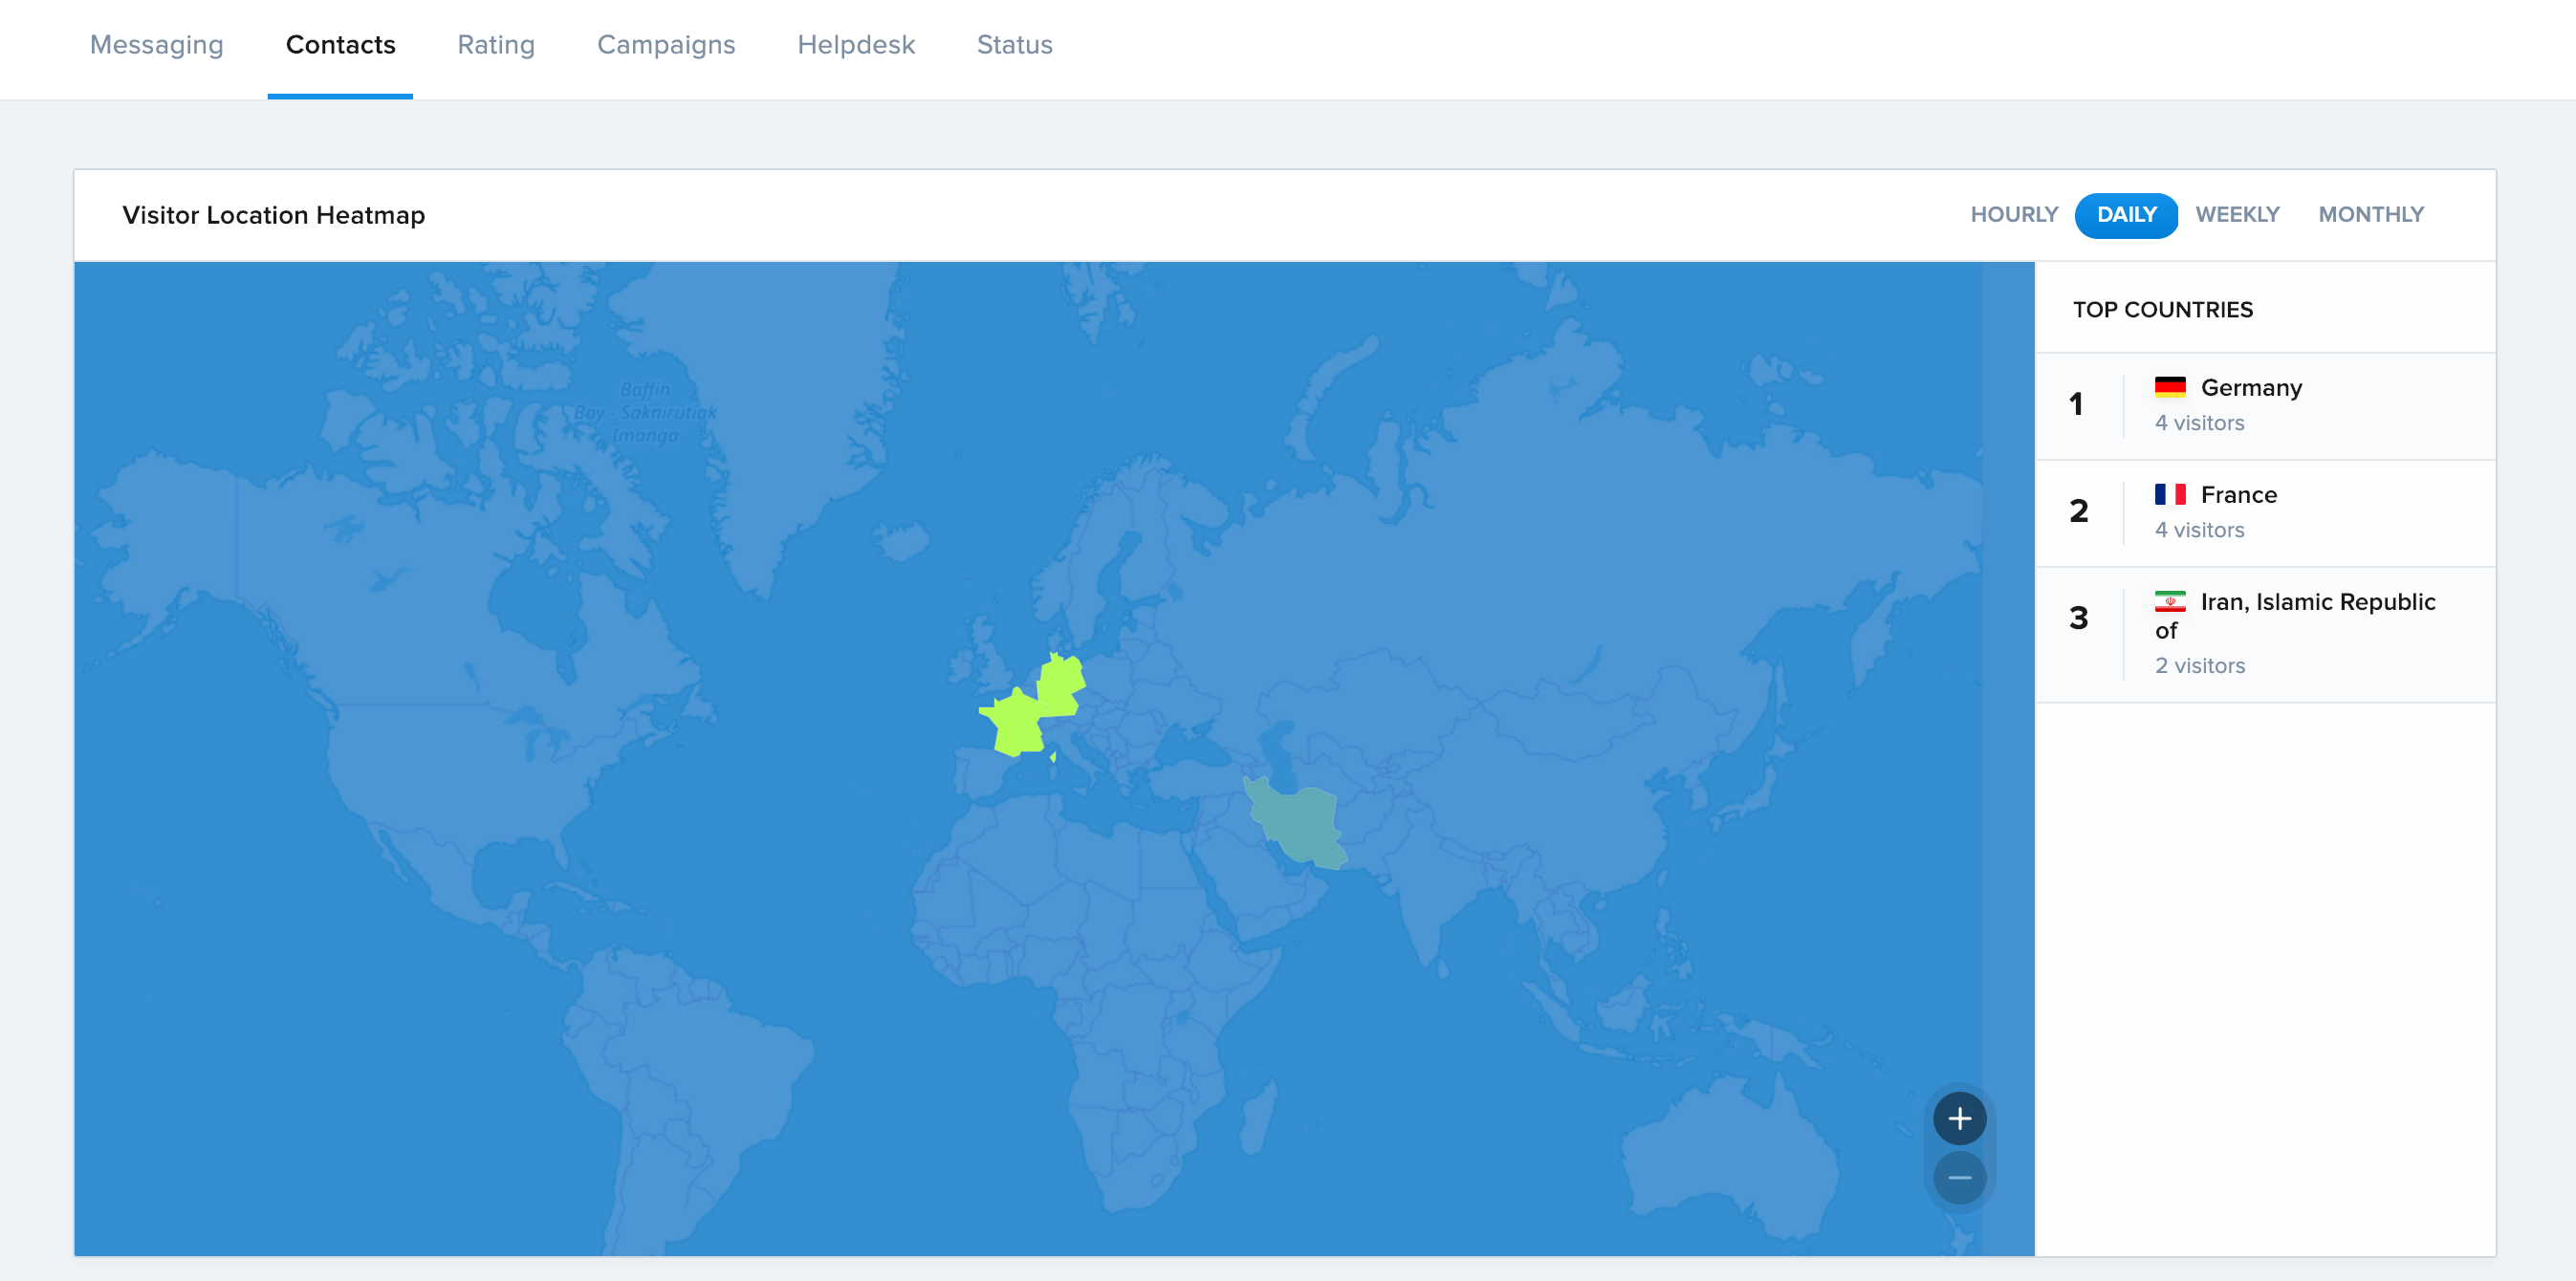
Existing users and new leads are Crisp's basis as we always want to help you at enhancing your pipeline creation rate so here are what you can now monitor :
- Visitors location heatmap by hours, days, weeks and months
- Website visit calendar per day and hours of the week
- Created contacts by hours, days, weeks and months
Ratings
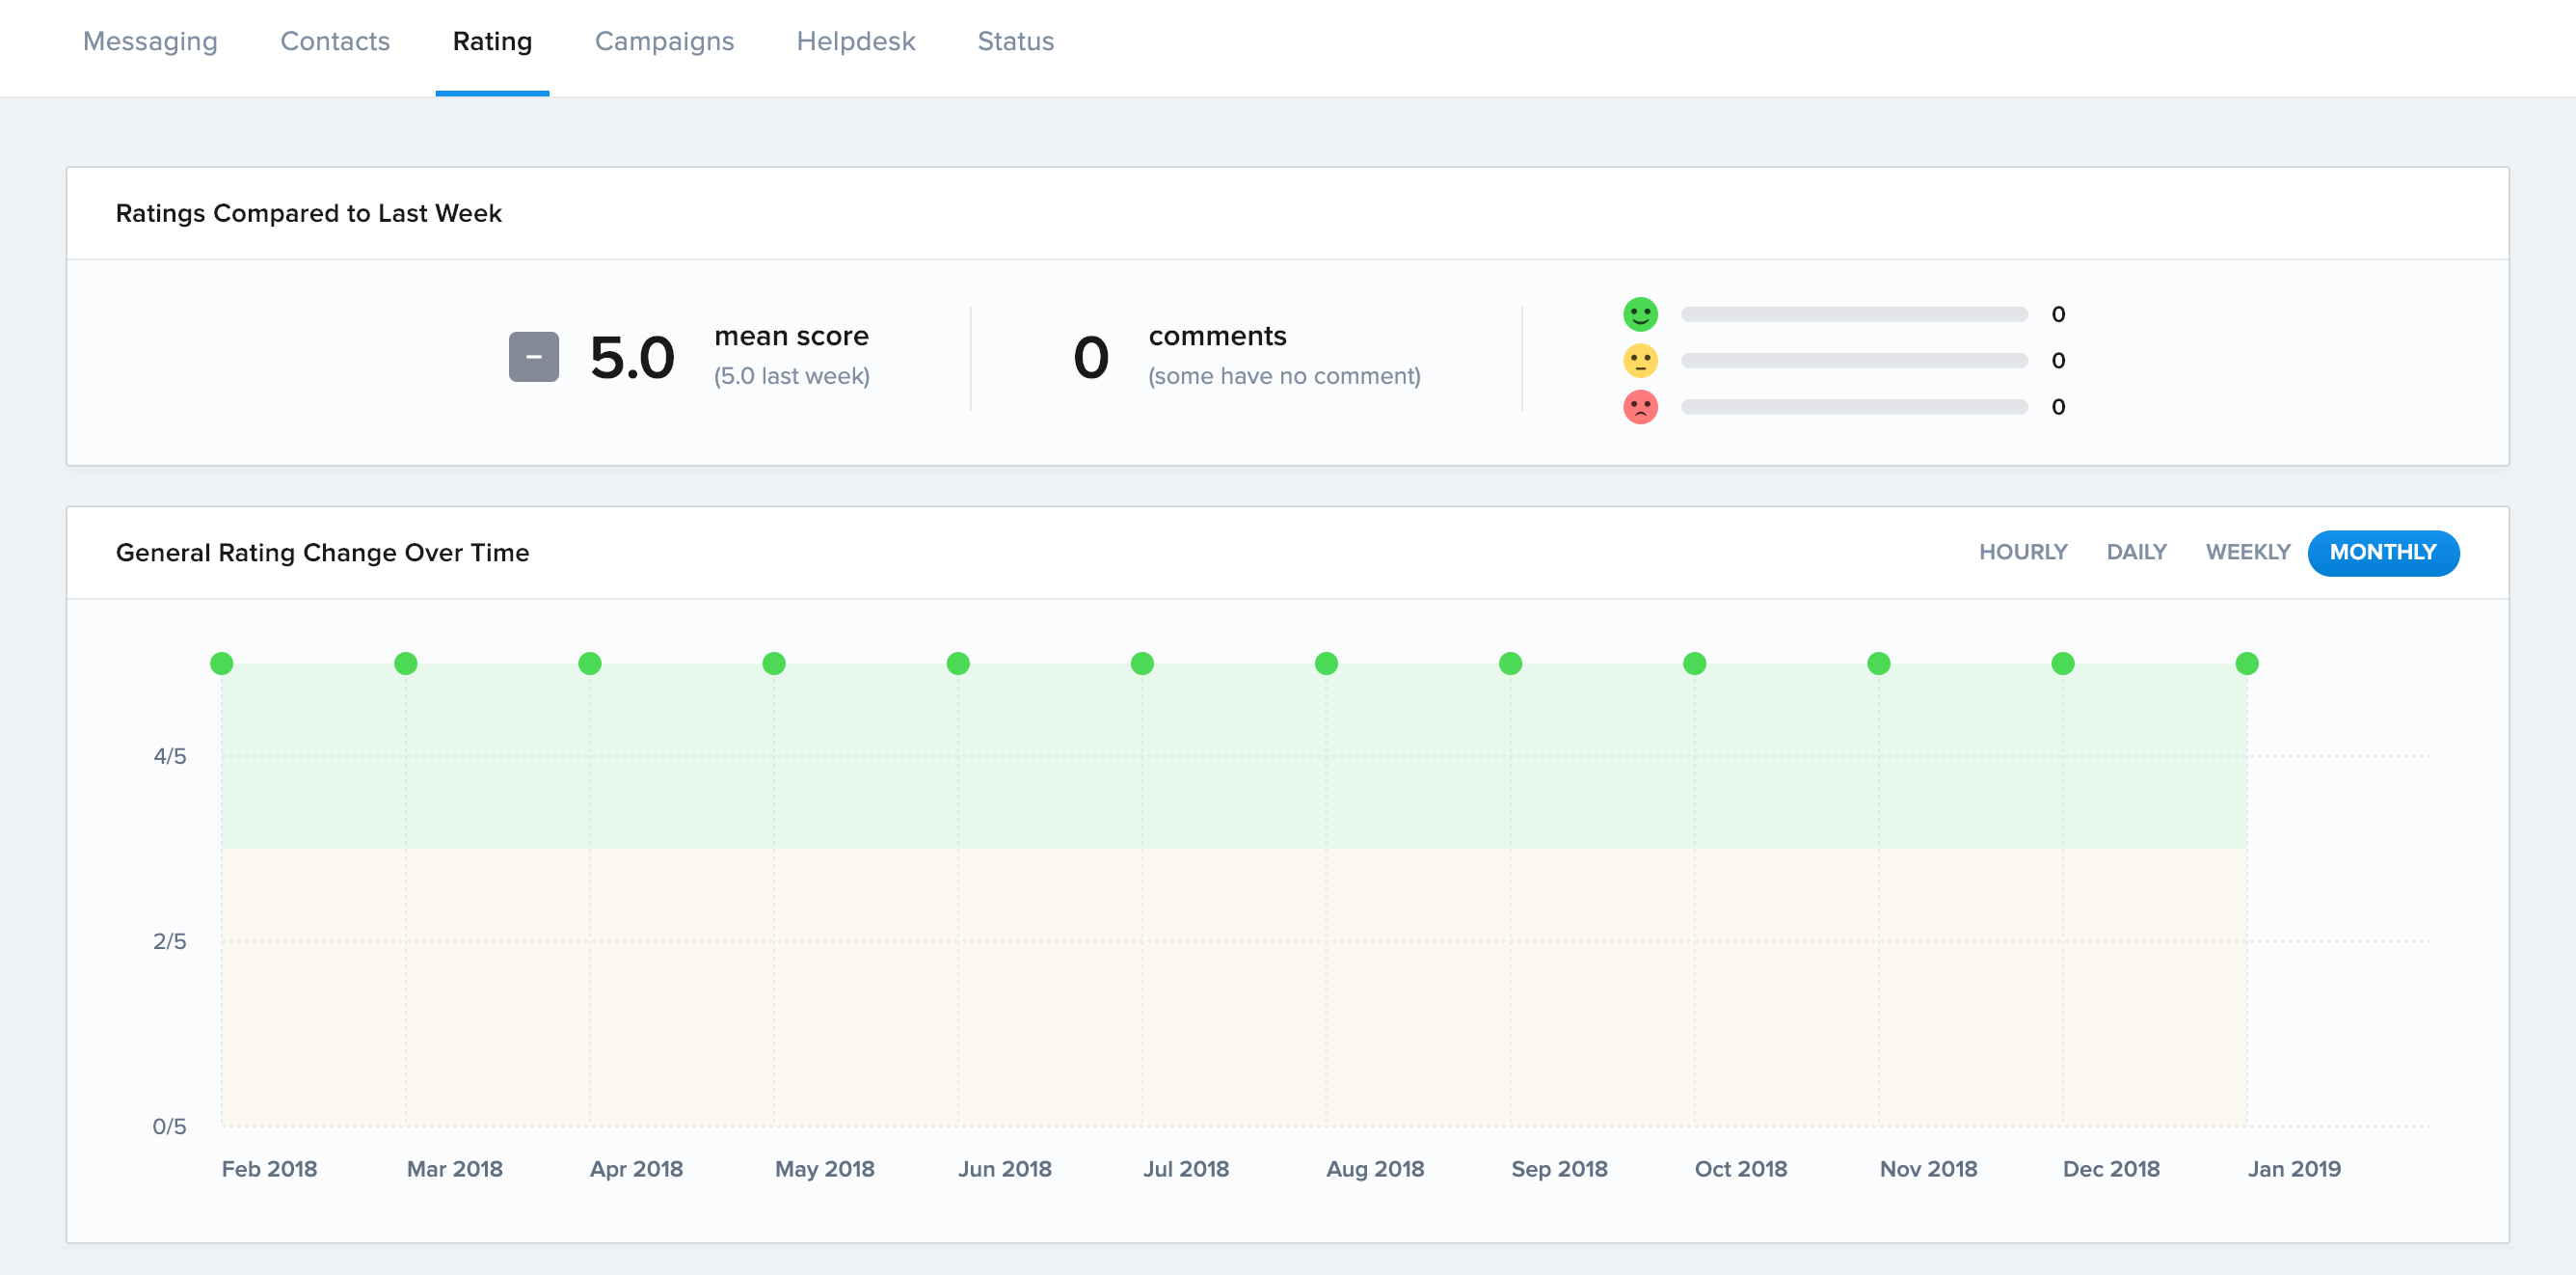
Customer ratings are a big mean for every business and as a part of our software, we wanted to increase company's knowledge about customers satisfaction.
- Average rating rate by hours, days, weeks and months
- Last ratings and comments by weeks
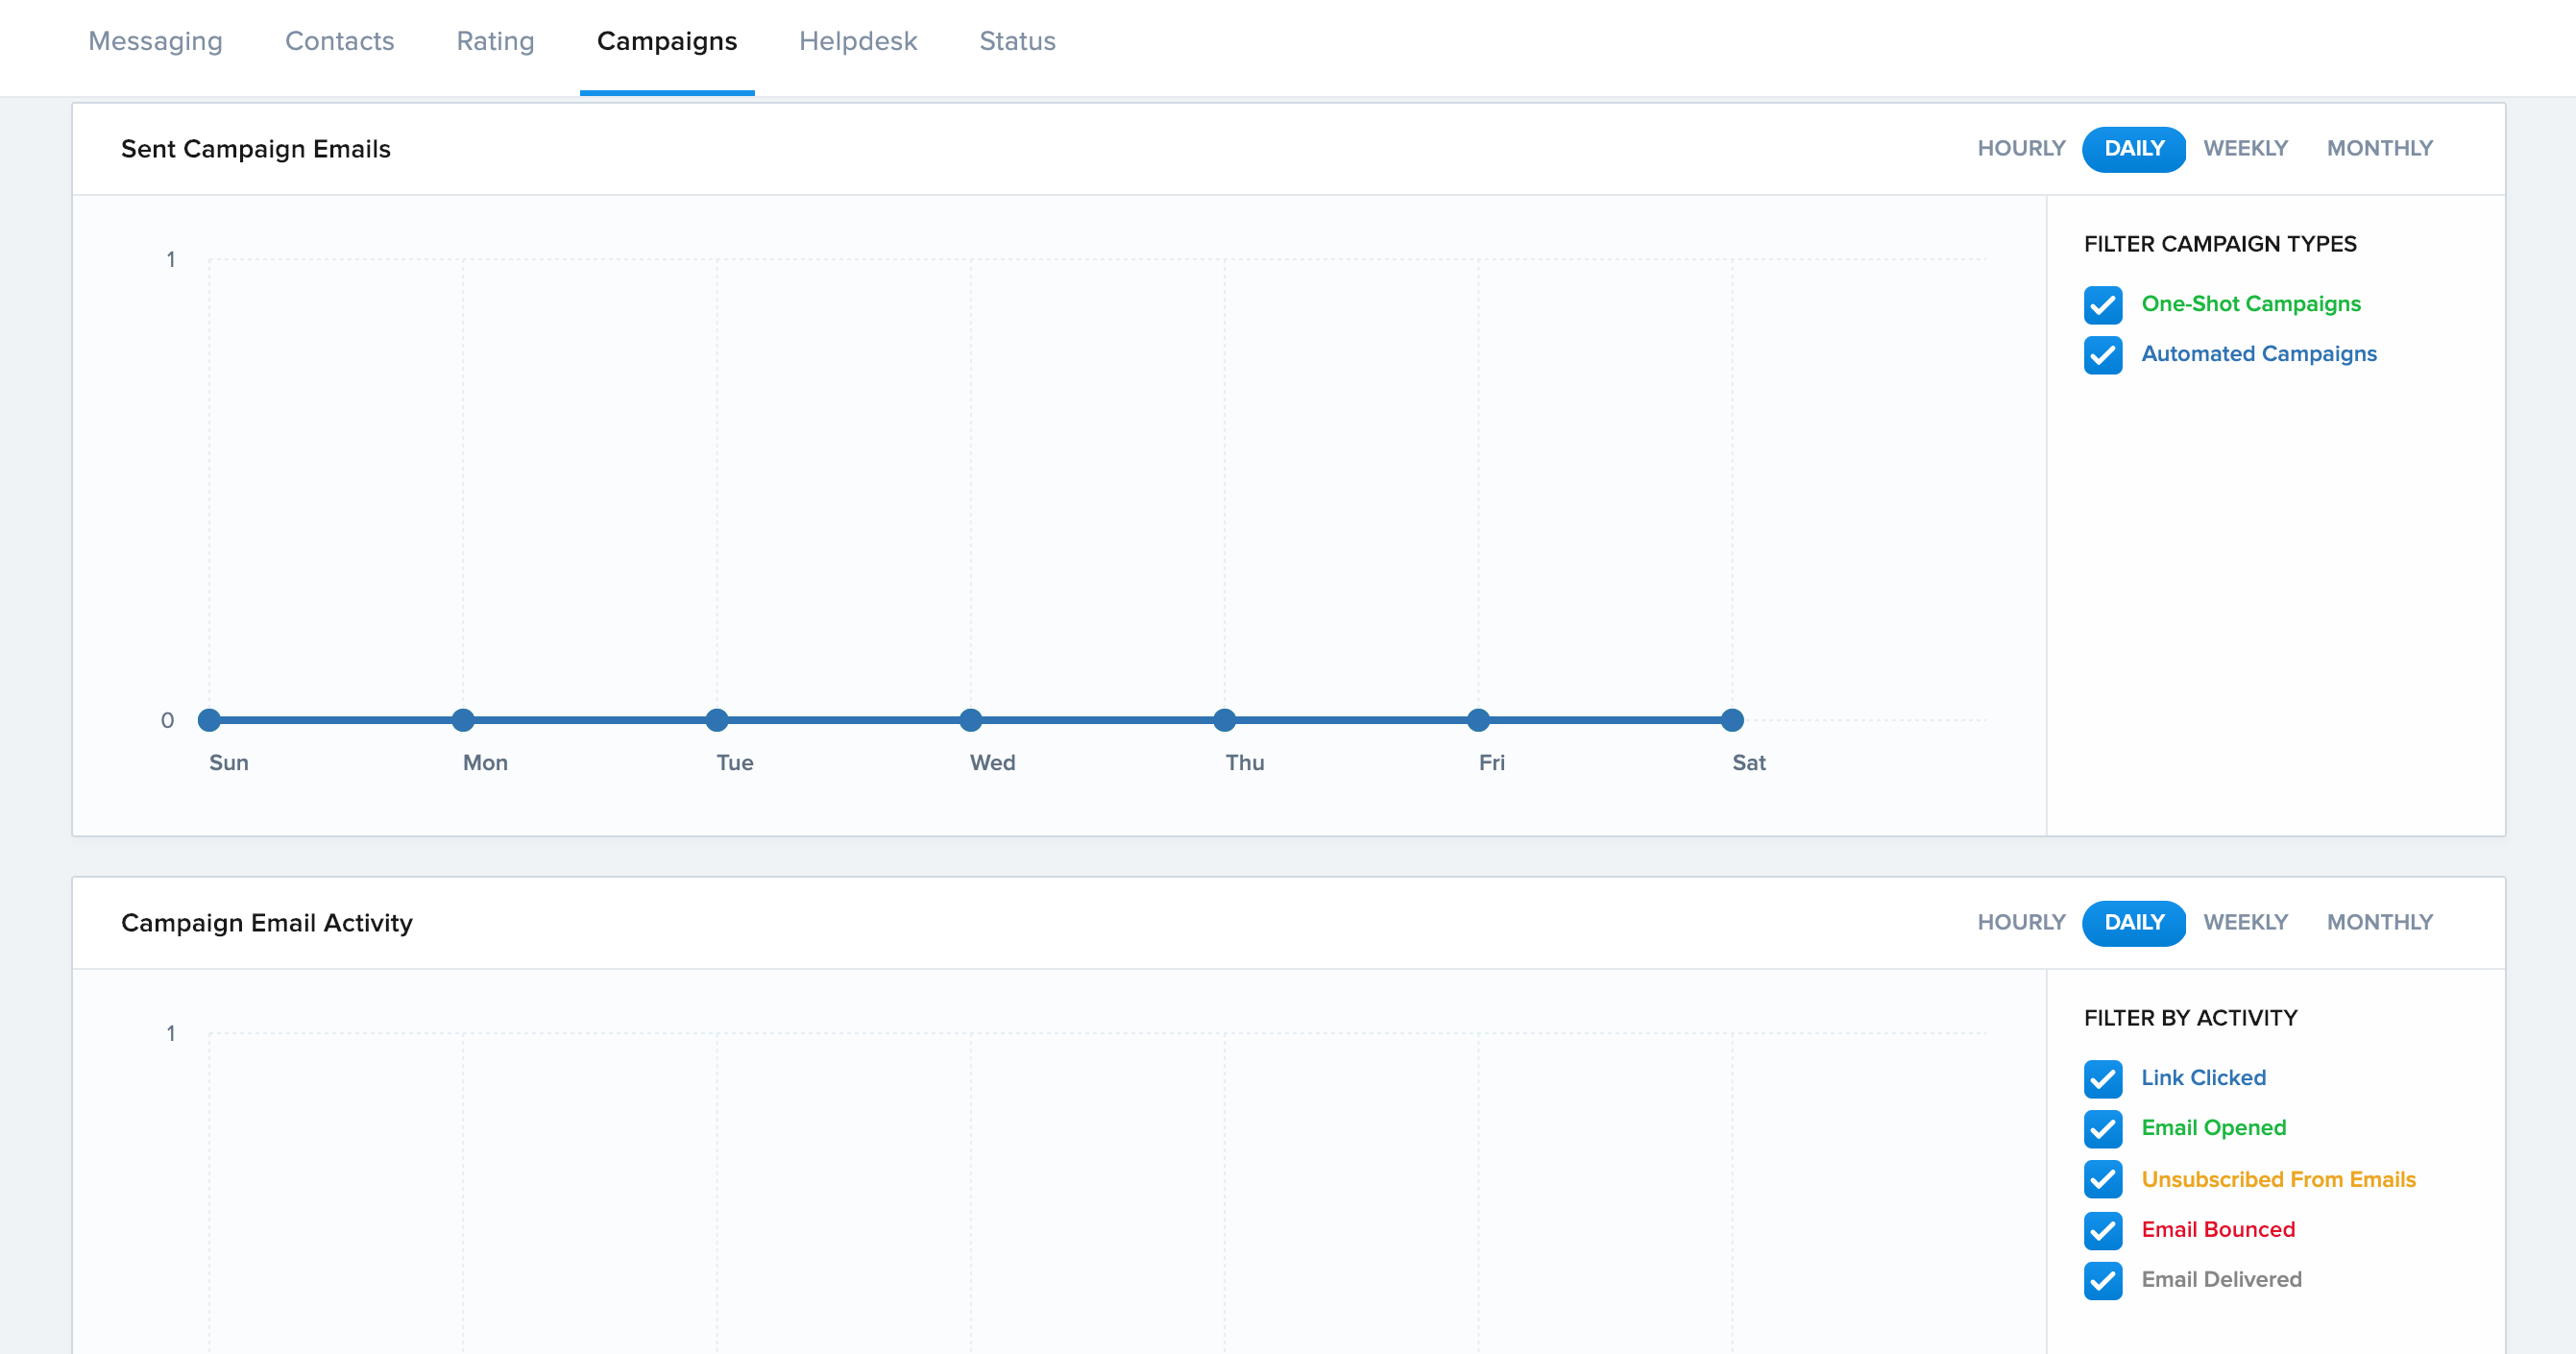
Campaigns
Emails and chat box notifications are very helpful while serving the customer journey so we wanted to give you insights about this.
- Sent emails campaigns by hours, days, weeks and months filtered by campaign types
- Campaigns emails activity by hours, days, weeks and months, filtered by clicked links, emails opened, unsubscribed users, email bounce and delivered emails
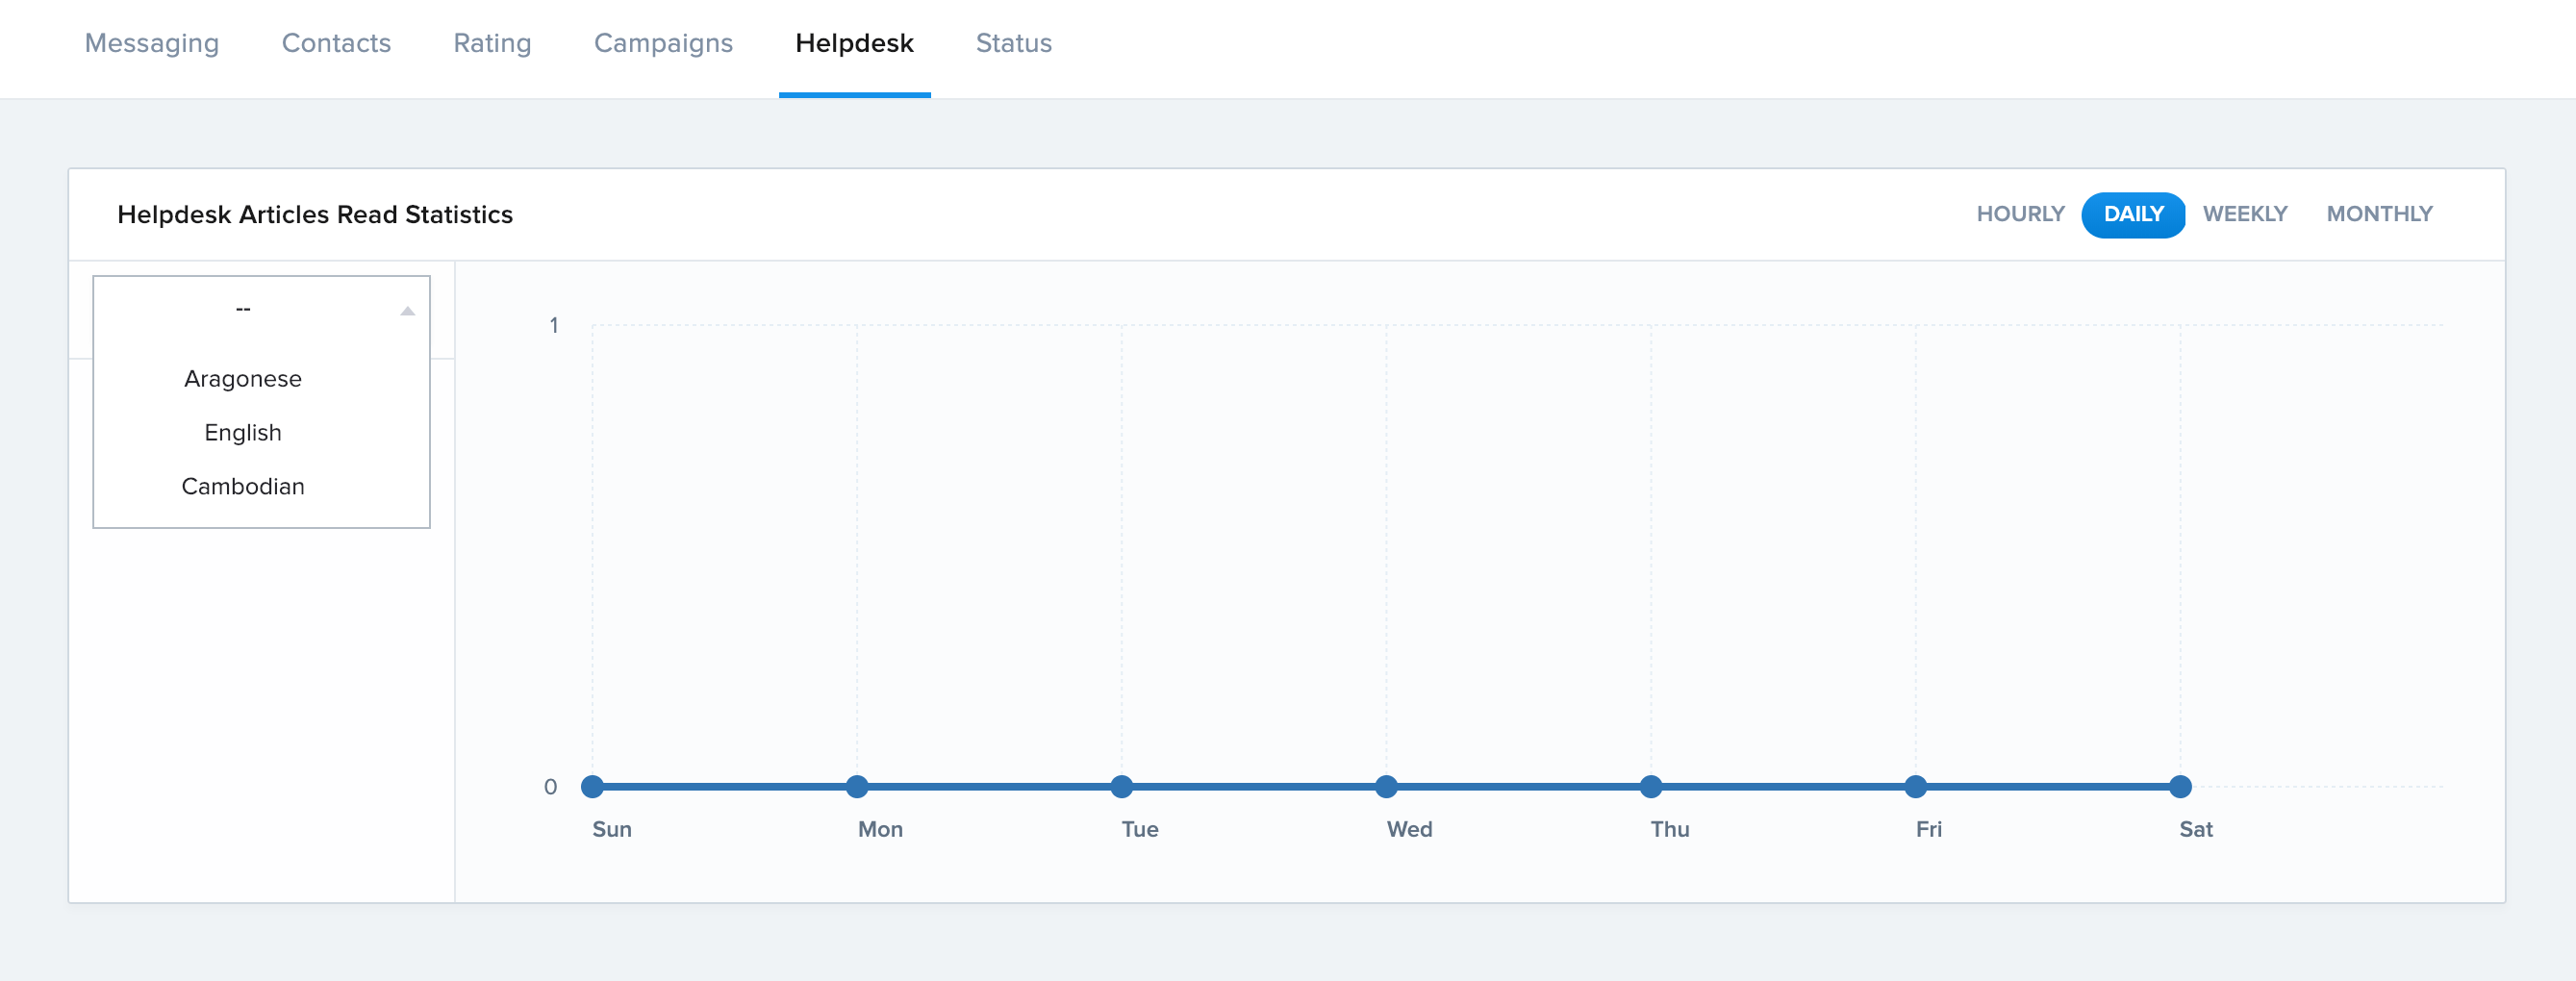
Helpdesk
Helpdesk's data is a great metrics because it gives you immediate knowledge on what topics are creating the most value for your users. Here is what you can look at :
- Read articles by hours, days, weeks and months filtered by articles
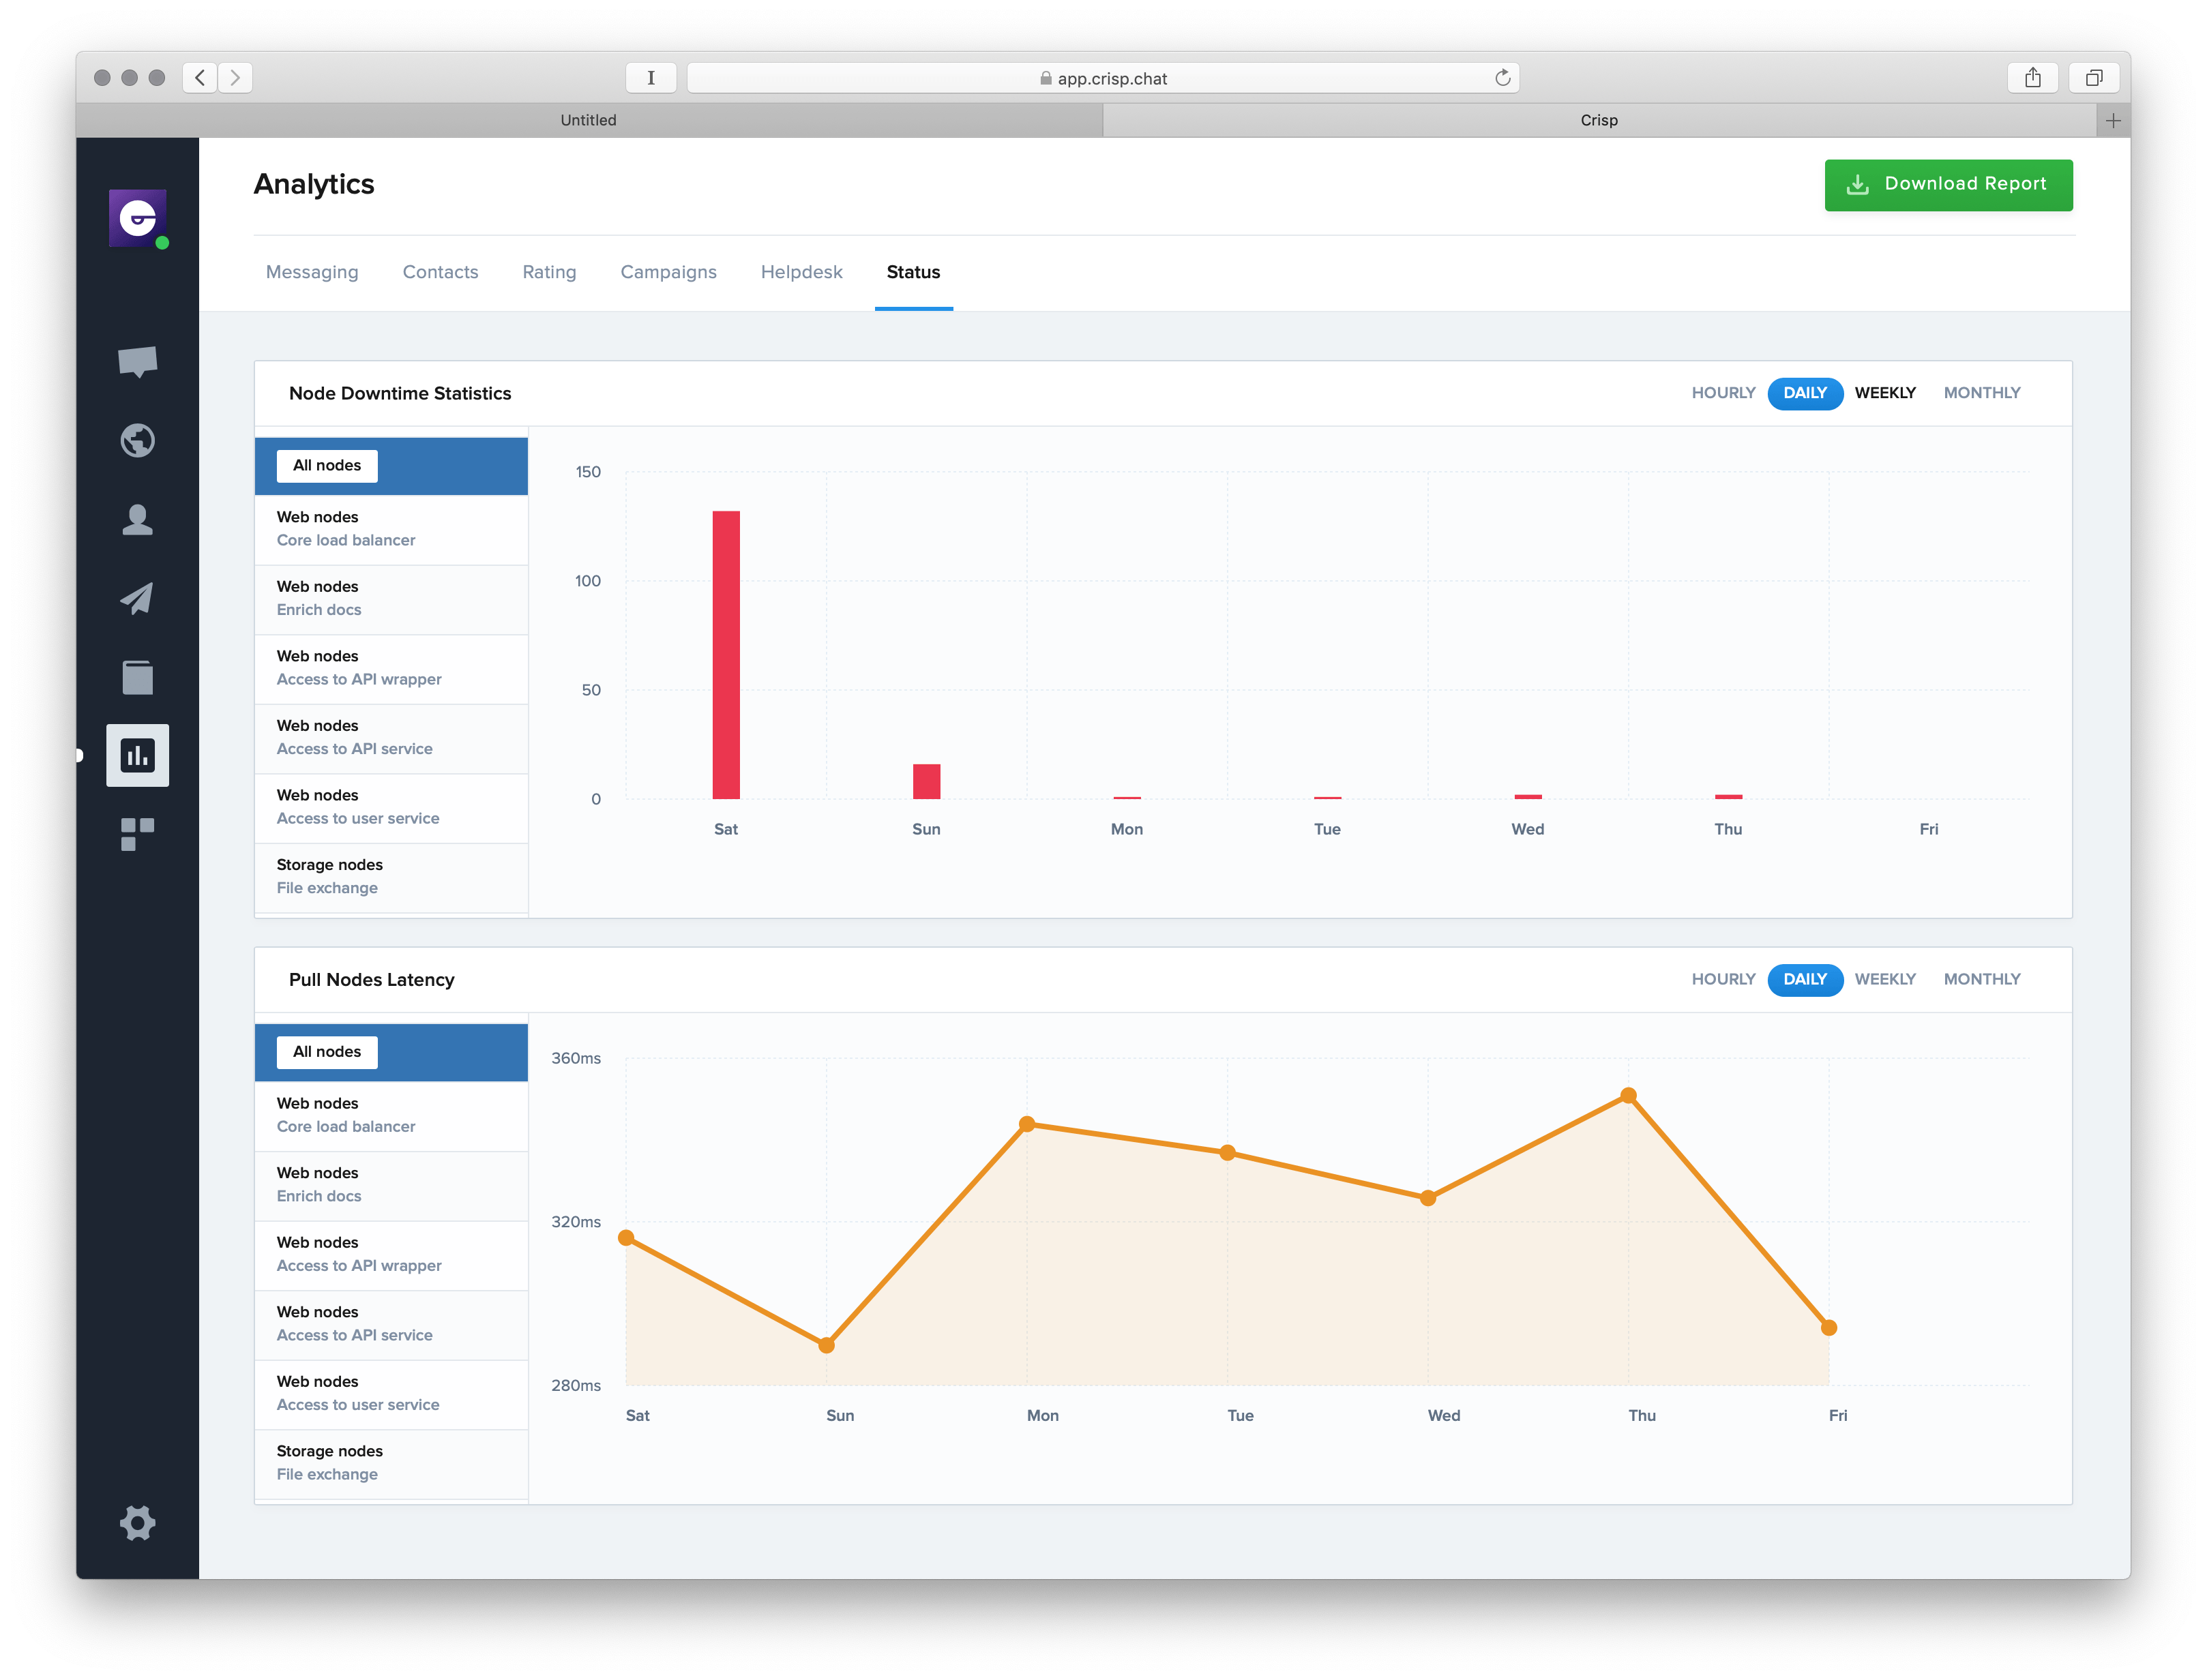
Status
Status has been made to watch for downtimes and availability. Right now, you are able to see your statistics.
- Downtimes by hours, days, weeks and months filtered by the kind of infrastructures
- Latency by hours, days, weeks and months filtered by infrastructures
If you have any questions, feel free to ask !

Automated ticket routing: how to get every conversation to the right agent
Manual triage worked when a manager could eyeball every conversation. Now that AI resolves the easy tickets automatically, what's left for your team is the hard, ambiguous residual: exactly the conversations where routing to the wrong agent hurts most.

Unified customer view: how to give every support operator full context before they reply
Most support setups store customer context in pieces: chat here, email there, a note nobody linked. This guide shows what a true unified customer view requires, why fragmented context gets more expensive as you scale.

Ticket escalation done right: how to move issues up the chain without losing context
When AI handles first contact, every handoff to a human should feel like a continuation, not a reset. Here's how to build escalation that carries full context and clear ownership at every step, instead of making customers repeat themselves.